


































Power BI Corporate Training in India — Excel Prodigy
We design every program around your team’s data, your business context, and your reporting goals — not a generic syllabus. Whether you’re an L&D manager building data literacy across departments or a department head standardizing reporting, Excel Prodigy delivers a structured, measurable outcome: teams who can build and present real Power BI dashboards by the end of the program.
Enquiry Now
Power BI Training Course Curriculum
Introduction:
- Introduction to Self-Service BI
- Standard Business Intelligence Process
- Introduction Power BI Desktop & Workflow
- Power BI Architecture & Power BI Services
Introduction to Power BI Desktop:
- Excel Vs Power BI Desktop & Advantage
- Power BI Components:
- Power Pivot, Power Query
- Power Map, Power View, Q&A
- Report Canvas, Visualizations, Filters & Fields Pane
- Power BI User Interface:
- Report View
- Data (Tables) View
- Relationship (Model) View
- Connect and Load data from CSV, Excel & Web
Power BI - Data Visualization:
Part 1
- Exploring Report View & Understanding Chart Elements
- Adding Chart to the Canvass
- Inserting basic Charts/Visuals and Creating Simple Report
- Cluster Column Chart
- Cluster Bar Char, TreeMap
- Line Chart, Pie Chart, Donut Chart
- Funnel Chart
- CARD Visual
- Table Vs Matrix
- Essential Formatting: Text Size, Legends, Values, Title
- Inserting Text Box, Shapes & Images
- Slicers: Vertical List Vs. Horizontal Tiles
- Tooltip - On hover Text
- Sort Visuals by Values/Fields
- Focus Mode, Explore & Export Data
Power Query - Data Transformation :
Part 1
- Exploring Power Query Editor
- Importing Data
- Preparing/Transforming Data for Power BI Dashboard
- Promoting First Row as Headers
- Renaming the Table and Column Names
- Remove Unwanted and Empty Columns
- Remove Top Rows, Blank Rows, Errors, Duplicate Rows
- Split Column by Delimiter, Characters, Positions
- Choosing the right Data Types - Whole Number, Date, Text
- Replacing Values and Column Formatting: Clean, Trim, Change Case
- Fill Blank Data with Above or Below Text
- Filtering Data, Removing, Reordering and Merging Columns
- Applied Steps - Its Usage & Revert Options
- Overview of M-Query Language
Data Modeling:
Power Pivot
- Introduction to Data Model
- Data Tables (FACT Tables) Vs Lookup Tables (Dimension Tables)
- Active & Inactive Relationship
- "Snowflake" Schemas Vs Star Schemas
- Understanding Relationship Cardinality
- One to Many
- One to One
- Many to Many
Power Query - Data Transformation - Merge & Append :
Part 2
- Creating Custom Column from Examples (Excel Flash Fill)
- Working with Conditional Columns
- Transpose Data (Rows to Columns)
- Unpivot Columns to convert unstructured data set to columnar table
- Grouping & Binning
- Merge Queries Vs Append Queries
- Merge Queries - Joins
- Left Outer, Right Outer,
- Inner Join
- Full Outer Join
- Left Anti
- Right Anti
- Append Queries
- From Different Sheets
- From Csv Files
- From Excel Files
- From Folder
- Creating Dimension Table using M-Query Language
- Enable Data load, Enable Data Refresh, Close and Apply
DAX - Data Analysis Expression:
Part 1
- What is DAX?
- Creating Simple Calculated Column & Calculated Measure
- Implicit Measure Vs Explicit Measure
- Calculated Columns Vs DAX Measure
- DAX - Calculated Columns
- RELATED
- FORMAT
- DATEVALUE
- DAY, MONTH, YEAR
- DAX - Calculated Measures
- SUM, COUNT, MAX, MIN
- COUNTROWS, DIVIDE
- DISTINCT COUNT
- DAX - Calculated Tables
- CALENDARAUTO
- CALENDAR, DATE
Power BI - Data Visualization:
Part 2
- Working with Multi-row Card
- Visualizing Data with Multiple Fields
- Stacked Bar, 100% Stacked Column
- Area Chart, Stacked Area
- Combo Chart
- Line & Cluster Column
- Line & Stacked Column
- Secondary Axis Chart
- Scatter (Bubble) Chart
- Visualizing Time Series Data
- Multi-Line Chart
- Ribbon Chart
- Waterfall Chart
- Visualizing Geospatial Data with Maps
- Point Map
- Fill Map
- Showing Key metrics with Cards, KPI Visuals & Gauge Chart
- Applying Condition Formatting
- Data Color
- Color Scale
- Rules
- By Field Values
- Table Formatting
- Background & Font Color
- Data Bar
- Icon Set
- Working with different Level of Filters
- Report Level
- Page Level
- Visual Level
- Top N
- Analytics Tab
- Adding Target Line
- Average, Median & Percentile Line
- Q&A - Ask Question (Natural Language)
- Hierarchies
- Timeline Slicer
DAX - Data Analysis Expression:
Part 2
- Creating Table for Measure (Measure Table)
- DAX - ADVANCED
- SUMX, COUNTX, AVERAGEX
- CALCULATE
- IF ELSE IF
- SWITCH
- AND, OR, NOT
- FILTER
- ALL
- HASONEVALUE
- SAMEPERIODLASTYEAR
- PARALLELPERIOD
- DATEADD
- DATEDIFF
Power BI - Data Connection:
- Understanding "xVelocity in-memory Analytical Engine" - Vertipaq
- Different Modes of Connection
- Live Connection
- Imported (Cashed)
- DirectQuery
- Get Data from
- Csv, Excel
- Access
- SQL Server
- Web
- ERP, CRM
- Cloud Services
- Update & Refreshing Dataset
- Changing Data Source
Power BI - Data Visualization:
Part 3
- Configuring Data for Q&A
- Adding Trendline & Forecasting
- Editing Power BI Report Interaction
- Adding and Updating Bookmarks
- Inserting Buttons
- Using Selection Panes to Control Visibility
- Synchronize Slicer Across Pages
- Displaying Report Page in Tooltips
- Importing Custom Visual from Marketplace
- Using Custom Visuals
- Creating Customized Color Themes and Templates
- Mobile Layout & Desktop Layout
Power BI Service - Publish & Sharing Reports:
- Publish Report from Power Desktop
- Understanding Dashboards, Tiles, Reports, Datasets, workbooks
- Creating Dashboard
- Pinning Tiles to Dashboard
- Sharing Reports & Dashboards
- Publish Reports to Web
- Print or Save as PDF
- Exporting to Powerpoint
- Refreshing Data Sets
- Workspace and Apps (Power BI Pro)
- Row Level Security (Power BI Pro)
Our Corporate Clients


Power BI Corporate Training Across Key Industries
Excel Prodigy has delivered Power BI training for corporate teams across India’s most data-intensive sectors. Our trainers understand the reporting challenges specific to each industry — so sessions use real use cases from your domain, not generic sample data.

BFSI (Banking, Financial Services & Insurance)
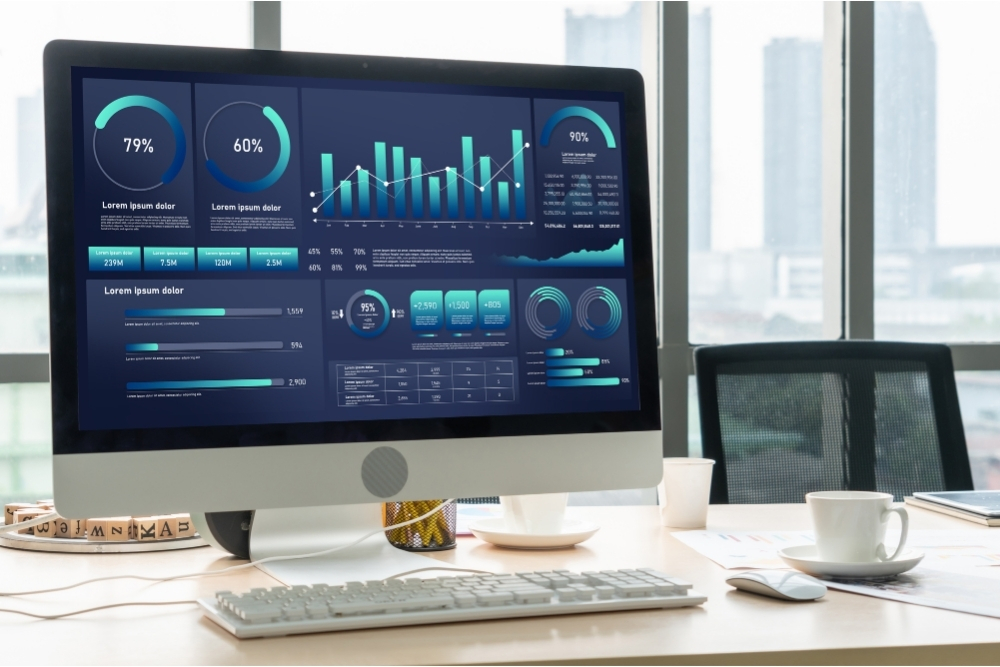
Loan portfolio dashboards, branch performance reports, risk monitoring views, P&L trackers
Manufacturing & Automotive
Production efficiency reports, OEE dashboards, supplier scorecards, inventory tracking

Pharma & Healthcare
Sales force effectiveness dashboards, clinical data reports, regional distribution trackers

Retail & FMCG
Sales performance dashboards, SKU-level analysis, store comparison reports, demand trend views

Logistics & Supply Chain
Fleet performance dashboards, delivery SLA tracking, warehouse utilization reports

IT & Technology
Project delivery dashboards, resource utilization reports, support ticket trend analysis

HR & People Analytics
Attrition dashboards, headcount trackers, recruitment funnel reports, training ROI views

Why Organizations Choose Excel Prodigy
Microsoft Certified Trainers
MCT & Data Analyst Associate credentials with real enterprise dashboard experience across BFSI, manufacturing, retail & healthcare.
1,500+ Corporate Batches
Delivered for Hitachi, Daimler, CEAT & Nissan across Chennai, Mumbai, Delhi, Bangalore, Hyderabad, Pune & Kolkata.
Customized Training
Every engagement starts with a needs assessment — different datasets & DAX use cases for banking, manufacturing, and more.
Hands-On Dashboard Building
Participants build 3+ working dashboards per program — ready for performance reviews or workplace reporting from day one.
Training Delivery Options
Corporate On-Site Training (Pan-India)
We travel to your office — Chennai, Mumbai, Delhi, Bangalore, Hyderabad, Pune, Kolkata, and other cities — and deliver training scheduled around your team's working hours. Ideal for departments that need synchronized, in-person upskilling.
Corporate Online Instructor-Led Training
Live, interactive sessions (not recorded videos) for distributed or remote teams. Scheduling is built around your team's working hours rather than a fixed public batch calendar.
Power BI Training Available Across India
Chennai
Mumbai
Delhi
Hyderabad
Pune
Dubai
Middle East
Testimonial
Excellent
"Excel Prodigy customized the Power BI training entirely around our banking data. Our team built loan portfolio dashboards on day one itself. Excellent trainer, very practical approach."
Frequently Ask Question — Corporate Power BI Training
Yes. Every corporate engagement begins with a needs-assessment call to understand your team's tools, data types, and reporting goals. Sessions, examples, and DAX use cases are built around your context — a banking analytics team and a manufacturing operations team receive different content.
Yes, across Chennai, Mumbai, Delhi, Bangalore, Hyderabad, Pune, Kolkata, and other cities. Online instructor-led delivery is also available for distributed teams.
We keep batches small intentionally so every participant gets hands-on support, particularly for DAX and data modeling — the topics most participants get stuck on in larger classes.
Yes — 30 days of post-training support, so participants and managers can get help applying what they learned to real dashboards.
Our curriculum is aligned with the Microsoft PL-300 (Power BI Data Analyst) certification framework. Participants get an Excel Prodigy completion certificate and guidance on how to pursue the official Microsoft exam separately.
Yes — share your team size, current skill level, and preferred timeline, and we'll send a customized proposal with pricing, schedule options, and curriculum outline.