
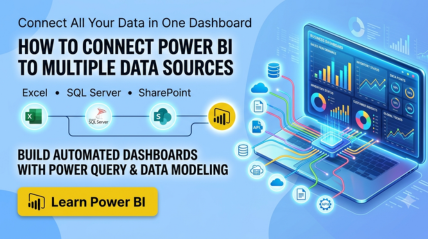
How to Connect Power BI to Multiple Data Sources in One Report
Picture this. You are the MIS analyst at a mid-sized manufacturing firm in Chennai. Your sales numbers live in an Excel workbook the regional teams update every evening. Your CRM data, leads, deal stages, customer history, sits inside a SQL Server database managed by IT. And your operations team shares production updates through a SharePoint list nobody outside the plant really looks at.
Your manager wants one dashboard, sales performance next to customer engagement next to plant output, refreshed automatically every morning, without you copy-pasting three spreadsheets into a fourth one at 11 PM.
This is exactly the situation Power BI was built to solve. And yet, for a lot of beginners and even intermediate users, the moment you try to bring Excel, SQL, and SharePoint into the same report, things start to feel like a failure. Power Query starts throwing warnings you do not fully understand.
If that sounds familiar, you are in the right place. This guide walks you through exactly how Power BI data connectors work, how to bring multiple sources into a single report cleanly, and how to avoid the mistakes that trip up most learners in their first few months of working with the tool.

Why Businesses Need Multi-Source Data Integration in Power BI
Very few organisations keep all their data in one place. Sales might sit in Excel because that’s what the regional team knows. Customer and transaction data lives in a proper database like SQL Server, because that’s what scales. And day-to-day operational data schedules, approvals, checklists, often end up in SharePoint, because it’s easy for non-technical teams to update.
The primary benefit of using Power BI is not only building pretty charts, but it acts as the connective layer that pulls all of this together, so a decision-maker is not flipping between four tools to piece together one story. Connect Power BI to multiple data sources correctly, and you get a single source of truth: one report, refreshed on schedule, reflecting your entire business rather than one department’s slice of it.
This is also exactly why Power BI data connectors are such a foundational skill for anyone in a data analyst, MIS, finance, or HR role today.
For students and early-career aspirants, this is often the real difference between “I can make a chart” and “I can build a report a business actually relies on” and it’s exactly the gap a good Power BI training course India-wide is designed to close.
What are Power BI Data Connectors
Before the steps, it helps to understand what a connector actually does. In simple terms, a Power BI data connector is the bridge between your report and wherever your data physically lives, a workbook on your laptop, a database on a company server, or a cloud service reached through Power BI SharePoint integration or Dynamics 365.
Power BI ships with connectors for a very wide range of systems: Excel and CSV files, SQL Server and other databases (Access, Oracle, MySQL), SharePoint lists and document libraries, web pages and APIs, and cloud platforms and CRMs like Salesforce or Dynamics. Each of these Power BI data connectors is built to understand:
- Structure of its source,
- SQL connector knows how to read tables and views
- SharePoint connector understands lists and libraries
When you choose “Get Data” inside Power BI Desktop, you’re really choosing which connector to activate. Picking the right one, and configuring its connection mode correctly, is where most beginners either save themselves pain later, or set themselves up for the refresh errors we’ll cover further down.
For anyone just starting out, a useful habit is to treat Power BI data connectors as building blocks rather than one-off settings. Once you understand how three or four of them authenticate and refresh, every new connector feels far less unfamiliar.
There are also three connection modes worth knowing upfront, because they affect performance and refresh behaviour significantly:
- Import mode: Pulls a copy of your data into Power BI’s in-memory engine. Fast, but needs a manual or scheduled refresh to stay current.
- DirectQuery: Queries the source live on every report load. Always current, but slower and dependent on source performance.
- Live Connection: Used with existing Power BI datasets or Analysis Services models rather than raw source systems.
For a report combining Excel, SQL, and SharePoint, most learners start with Import mode across all three sources, since it’s simpler to manage relationships and refresh schedules while you’re still building confidence.
Step 1: Setting Up the Power BI Excel Connection
Excel is usually the easiest starting point, and where most beginners get their first real win.
- Open Power BI Desktop and click Get Data on the Home ribbon.
- Select Excel Workbook from the list of connectors.
- Browse to your file, in our scenario, the sales tracker your regional team updates daily.
- In the Navigator window, tick the specific sheet or table you need. Avoid loading the entire workbook if you only need one tab; it keeps your model lighter.
- Click Transform Data rather than Load directly. This opens Power Query, where you can clean column names, remove blank rows, and fix data types before anything touches your report.
A clean Power BI Excel connection at this stage saves you enormous rework later, most relationship errors trace back to inconsistent column naming or mismatched data types brought in from this very first step.
If you are a student practising on sample datasets, this is a good habit to build early: a tidy Power BI Excel connection today means far fewer surprises when you eventually work with a live corporate workbook.
Step 2: Connecting to Your Power BI SQL Database
Next, bring in your CRM or transactional data from SQL Server.
- Click Get Data again, and this time choose SQL Server from the database connectors list.
- Enter your server name and, if required, your specific database name. Your IT team can usually provide this in seconds.
- Choose your connectivity mode, Import for most learning scenarios, or DirectQuery if your organisation needs real-time figures and your SQL Server can comfortably handle live queries.
- In the Navigator, select the relevant tables, customer master, deal stages, transaction history, rather than importing every table in the database.
- Authenticate using Windows or Database credentials, depending on how your organisation’s SQL Server is configured.
A Power BI SQL database connection tends to feel intimidating the first time, mostly because of the credentials step. Once you’re past that, it behaves exactly like any other connector inside Power Query.
Aspirants preparing for data analyst interviews should get comfortable setting up a Power BI SQL database connection more than once, it is one of the most commonly tested practical skills in corporate screening rounds.
Step 3: Bringing In SharePoint Data
Finally, connect the SharePoint list or document library your operations team uses.
- From Get Data, search for and select SharePoint Online List.
- Paste in your SharePoint site URL, not the URL of the specific list, just the site itself.
- Choose between Import and DirectQuery once again, and let Power BI display the available lists and libraries on that site.
- Select the relevant list, load it into Power Query, and clean it the same way you did your Excel data.
Power BI SharePoint integration is genuinely one of the more underused capabilities in corporate reporting, most HR and operations teams already store approvals, trackers, and checklists in SharePoint without realising it can feed directly into a live dashboard.
Learning Power BI SharePoint integration early also sets you apart, since fewer beginners bother practising it compared to the more familiar Excel and SQL connectors.
Using Power Query in Power BI to Merge and Append Data
With all three sources loaded, the real craftsmanship happens inside Power Query in Power BI, this is where scattered tables become one coherent model. There are two operations you will use constantly:
- Merge Queries: used when you want to combine columns from two tables based on a matching field, similar to a VLOOKUP or a database join. You’ll choose between Inner, Left Outer, Right Outer, Full Outer, or Anti joins depending on which rows you want to keep.
- Append Queries: used when you want to stack rows from similar tables on top of each other, such as combining monthly sales sheets into one continuous table.
For our scenario, you would typically merge the SQL customer table with the Excel sales table using a common customer ID field, and append monthly SharePoint operational logs into a single running table.
Most students skip past Power Query in Power BI too quickly, eager to reach the “visual” part of building a dashboard. That is worth avoiding, an extra hour spent genuinely understanding it before you touch a single chart saves several hours of debugging later.
Building Your Power BI Data Model After Connecting Sources
Once your data is cleaned and merged, the next job is building a proper Power BI data model, teaching Power BI how your tables relate to one another.
The foundation is understanding Fact tables versus Dimension tables. A well-built model typically follows a Star Schema, with fact tables at the centre and dimension tables surrounding them, each linked by a single, clean relationship.
If you take away only one lesson from this section, let it be this: a strong Power BI data model is worth more than a dozen beautifully formatted visuals sitting on top of a shaky one.
Aspiring analysts often over-invest in chart design and under-invest in the data model underneath it, a gap most good Power BI training course India programmes are specifically built to close, and it shows the moment someone asks a question the report wasn’t built to answer.
How the Data Flows: A Quick Walkthrough
Sketched on a whiteboard, the entire process looks like this:
Excel (sales data) + SQL Server (CRM data) + SharePoint (operations data) → Power Query (clean, merge, append) → Data Model (fact and dimension tables, relationships) → Report Canvas (visuals, filters, slicers)
Each source flows into Power Query independently, gets shaped there, and only then joins the data model as a properly structured table. A clean model upstream is exactly why the report downstream stays fast and reliable.
Common Errors When Connecting Multiple Data Sources
Almost every learner runs into a version of these issues with their Power BI data connectors. Here’s what typically goes wrong, and the fix:
- i) Data refresh errors after publishing: This usually happens because Power BI Desktop can access your files or database directly, but the Power BI Service cannot, especially when your Power BI SQL database or Power BI Excel connection points to an on-premises source.
The fix is setting up a Gateway (specifically the On-premises Data Gateway) so scheduled refreshes can reach those sources securely.
- ii) “Column not found” or mismatched schema errors: Common when a source file’s column names or order change between refreshes in your Power BI Excel connection, such as a renamed column in a monthly Excel sheet.
Locking down consistent naming conventions with your source teams, and using Power Query’s applied steps to standardise, largely eliminates this.
iii) Broken relationships between tables: Usually caused by data type mismatches (a customer ID stored as text in one table and as a number in another) or duplicate keys in what should be a unique dimension table. Checking data types immediately after import, and removing duplicates from lookup tables, resolves most of these.
- iv) SharePoint list throttling or incomplete data: Large SharePoint lists sometimes hit item-limit throttling when connected via Power BI SharePoint integration, silently loading only part of your data. Filtering the list before load, or switching to the folder-based connector for document libraries, usually resolves this.
- v) Confusing merge results: New learners frequently pick the wrong join type inside Power Query in Power BI and end up with far more or far fewer rows than expected.
Before finalising a merge, glance at the row count if it is ballooned unexpectedly, you’re likely dealing with a many-to-many join that needs revisiting.
- vi) Slow report performance with DirectQuery: If your report feels sluggish, it is often because DirectQuery is querying a large Power BI SQL database live on every interaction. Switching lower-volume tables to Import mode, while keeping only the largest, most time-sensitive table on DirectQuery, usually restores speed.
The Excel Prodigy Advantage for Learners
Excel Prodigy’s Power BI training is led by Microsoft Certified Trainers with genuine industry experience, not just theoretical instructors. Having delivered 1,500+ Excel and Power BI corporate trainings across India, the institute understands exactly where beginners struggle with real, messy datasets.
Small batch sizes ensure personalised attention, while post-training support helps aspirants troubleshoot even after the course ends. With 300+ learners placed and trusted corporate names, we have built a proven, dependable track record for turning beginners into confident, job-ready Power BI professionals.
Ready to Go Beyond the Basics?
If you are serious about building this skill properly, learn Power BI data modeling in our corporate training at Excel Prodigy. As one of the leading names for Power BI training course India-wide, our instructor-led sessions, led by Microsoft Certified Trainers cover everything from your first data connection to advanced DAX and enterprise-level report publishing, with hands-on practice on real, messy, multi-source datasets exactly like the one in this guide.
For students and freshers especially, this is the efficient route in: rather than piecing together scattered tutorials on Power BI data connectors, a proper Power BI training course India employers recognise gives you a certificate, a portfolio of real dashboards, and the confidence to walk into an interview and talk through your own multi-source Power BI project.
Take the leap into data analytics, Excel Prodigy’s Power BI training gets you job-ready.
Frequently Asked Questions
- Can Power BI connect to multiple sources at once?
Yes, Power BI can connect to multiple data sources, such as Excel, SQL Server, and SharePoint, within a single report. Power Query lets you clean, merge, and append these sources into one unified data model. Once modeled correctly, all your data refreshes and reports together as one connected system.
- Which connection mode should beginners use when combining Excel, SQL, and SharePoint?
Import mode is generally the easiest starting point for beginners setting up their first Power BI Excel connection, Power BI SQL database, and Power BI SharePoint integration together, since it’s simpler to manage relationships and troubleshoot compared to DirectQuery.
- Why does my Power BI report show a refresh error after publishing to the cloud?
This typically happens when the Power BI Service can’t reach an on-premises file or database directly; setting up an On-premises Data Gateway usually resolves it.
- Do I need to know SQL to connect Power BI to a SQL database?
Not necessarily. Power BI’s Navigator lets you visually select tables without writing a single query, though basic SQL knowledge helps when working with larger, more complex databases.
- Is a formal Power BI training course worth it just to learn multi-source connections?
Yes, a structured Power BI training course India professionals trust covers connectors, Power Query, and data modeling together rather than as scattered tutorials, which is especially useful for beginners juggling Excel, SQL, and SharePoint at the same time.
